
Figure 10.
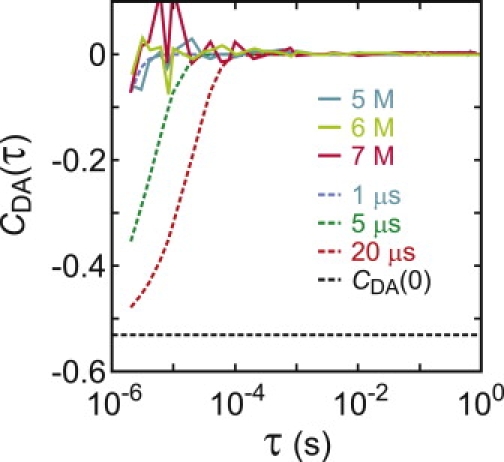
Donor and acceptor intensity cross-correlation function averaged over all unfolded segments longer than 5 s (continuous curves) at 5, 6, and 7 M urea. (Dashed curves) Simulated correlation decay with decay times of 1, 5, and 20 μs with the amplitude at τ = 0 (CDA(0) = −0.53) calculated for the FRET efficiency distribution for a Gaussian chain (see Eq. S6, Eq. S7, Eq. S8, and Eq. S9).