
Figure 11.
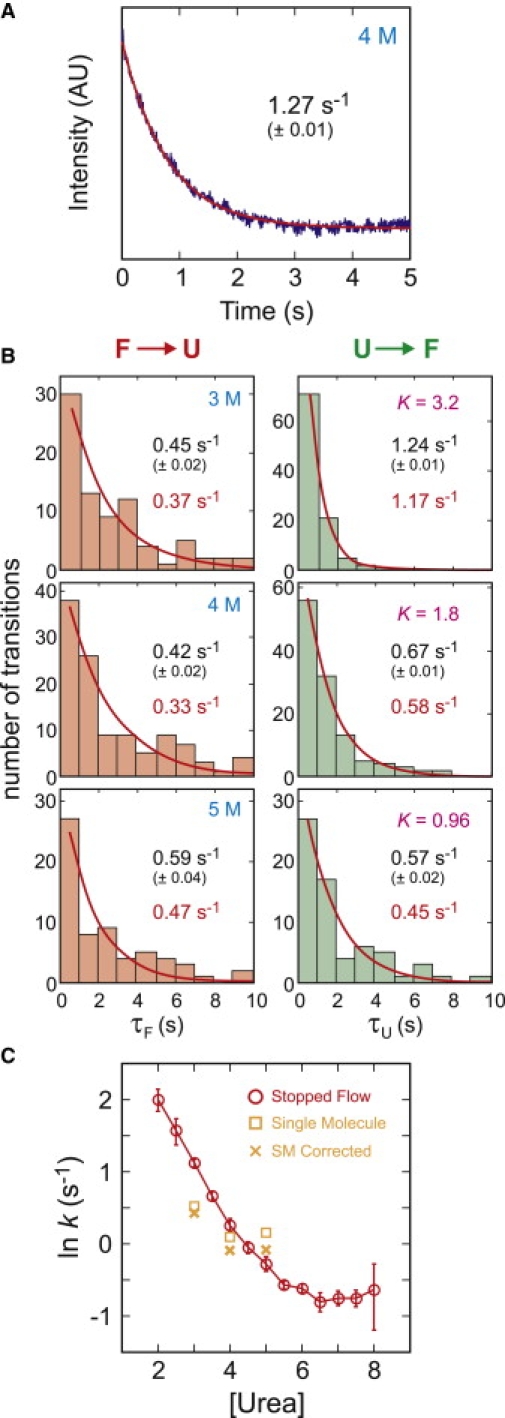
Folding and unfolding kinetics. (A) Time course of unfolding/refolding after rapid change in denaturant concentration in an ensemble stopped-flow mixing experiment. The continuous curve is an exponential fit to the data. (B) Waiting-time distributions in single-molecule experiments. Folding and unfolding rate coefficients were obtained from the exponential fits of waiting-time distributions. Errors were calculated from the fit with 60% confidence level (1σ). (Red) Rates corrected for the finite length of trajectories. (C) Comparison of the single-molecule kinetics with ensemble kinetics from stopped-flow measurements with dye-labeled proteins.