
Figure 5.
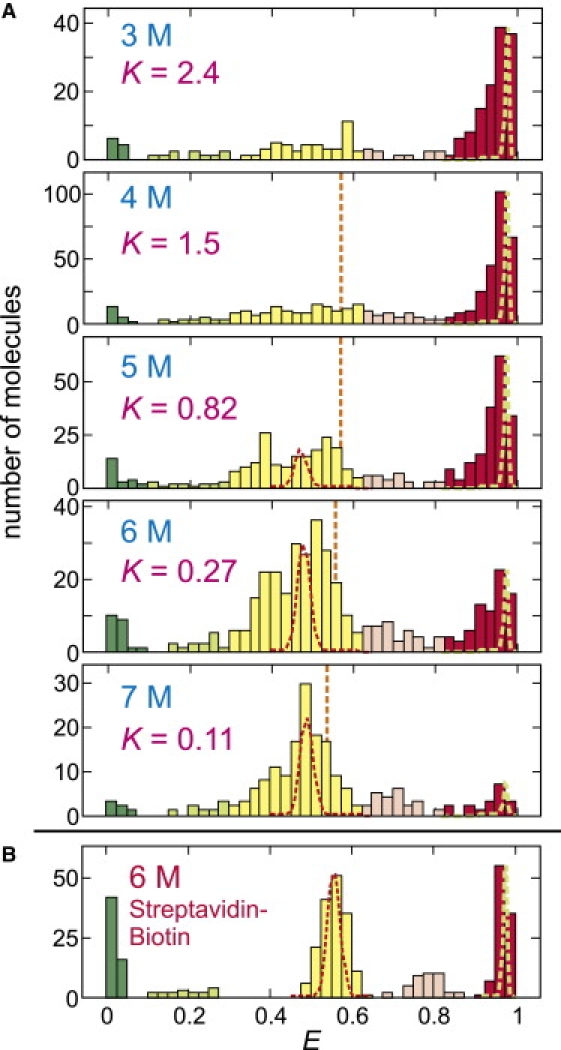
FRET efficiency histogram of immobilized proteins. (A) The distribution was obtained from the FRET efficiencies of the initial segments of the trajectories. The ranges of the states are E < 0.1 (green, donor only), 0.1 ≤ E < 0.3 (light green, donor only with Alexa 488R), 0.3 ≤ E < 0.625 (yellow, unfolded), 0.625 ≤ E < 0.825 (light red, unfolded with Alexa 488R), and E ≥ 0.825 (red, folded). These ranges are based on the results in panel B for the streptavidin-biotin immobilization, where the separate states from Alexa 488R are clearly resolved. The equilibrium constant was calculated from the ratio of the fractions belonging to the folded and unfolded states (K = fF/fU). (Red and green dashed lines) Distributions due solely to shot noise for >1000 photons for unfolded and folded peaks, respectively. (Orange vertical lines) Mean FRET efficiencies of the unfolded state in free diffusion experiment in Fig. 2. (B) The result for streptavidin-biotin immobilization is shown for comparison (from (19)).