
Figure 7.
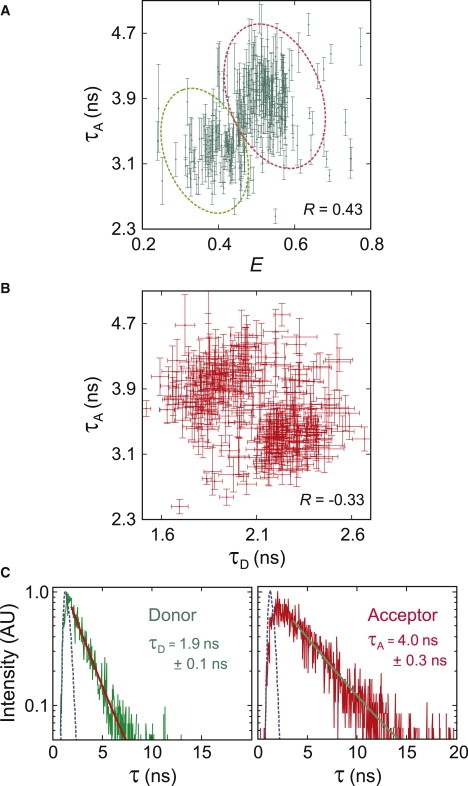
Correlations between the acceptor lifetime and the apparent FRET efficiency (R = 0.43) (A) or the donor lifetime (R = −0.33) (B). (Dotted curves in A) Outline of the clusters that were used in constructing the histogram in Fig. 8. (Error bars) Indicate ±1σ in the exponential fit shown in panel C. Representative distributions of time delays between excitation and detection. (Blue-dashed lines) Instrument responses of the avalanche photodiodes for the donor and acceptor channels. (Thick solid lines) Exponential fits (I = aexp[−τ /τD,A] + b).