
Figure 8.
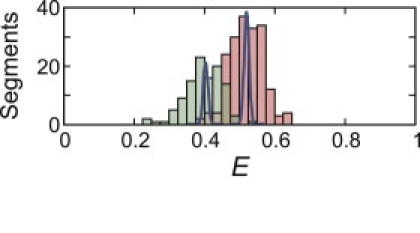
FRET efficiency distributions of the two clusters of unfolded segments in Fig. 7A. The continuous curves are the shot-noise–limited widths calculated for 5000 photons, the minimum number of photons in the sum of the segments for each trajectory.