
Figure 9.
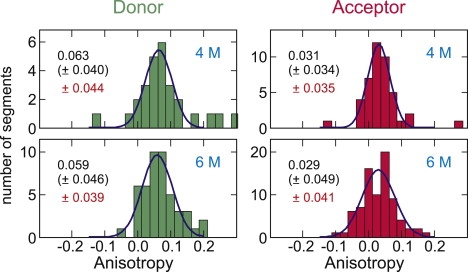
Anisotropy measurements for donor- and acceptor-labels on His-GB1K10C/C57 at 4 M and 6 M urea. Errors (standard deviation) from Gaussian fits for the distribution (black) are compared with the errors calculated from the trajectories (red).
Official websites use .gov
A
.gov website belongs to an official
government organization in the United States.
Secure .gov websites use HTTPS
A lock (
) or https:// means you've safely
connected to the .gov website. Share sensitive
information only on official, secure websites.
Anisotropy measurements for donor- and acceptor-labels on His-GB1K10C/C57 at 4 M and 6 M urea. Errors (standard deviation) from Gaussian fits for the distribution (black) are compared with the errors calculated from the trajectories (red).