
Fig. 5.
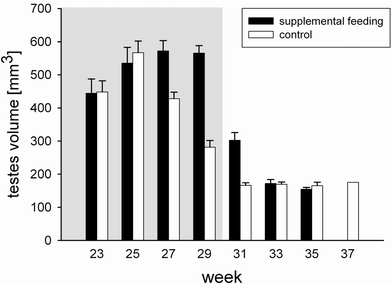
Testes volume (mean + SEM) of adult and yearling males (pooled). The gray area marks the time period in which supplemental food was provided. Supplemental feeding N = 13/16/22/13/9/17/11/0; control N = 15/40/59/40/37/31/8/1
Official websites use .gov
A
.gov website belongs to an official
government organization in the United States.
Secure .gov websites use HTTPS
A lock (
) or https:// means you've safely
connected to the .gov website. Share sensitive
information only on official, secure websites.
Testes volume (mean + SEM) of adult and yearling males (pooled). The gray area marks the time period in which supplemental food was provided. Supplemental feeding N = 13/16/22/13/9/17/11/0; control N = 15/40/59/40/37/31/8/1