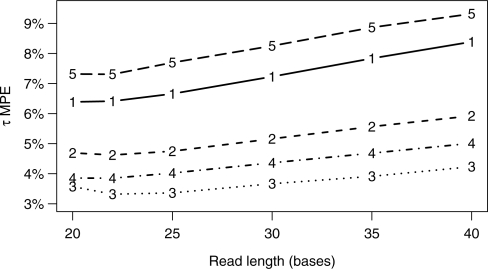
Fig. 2.
Gene expression estimation accuracy varies with read length given fixed base throughput (T). The curves are (1) mouse liver, T=375 × 106, (2) mouse liver, T=750 × 106, (3) mouse liver, T=1.5 × 10⁷, (4) mouse brain, T=750 × 106 and (5) maize, T=750 × 106. The τ MPE was calculated with respect to the true expression values for all genes with true level at least 1 TPM.

