
Figure 3.
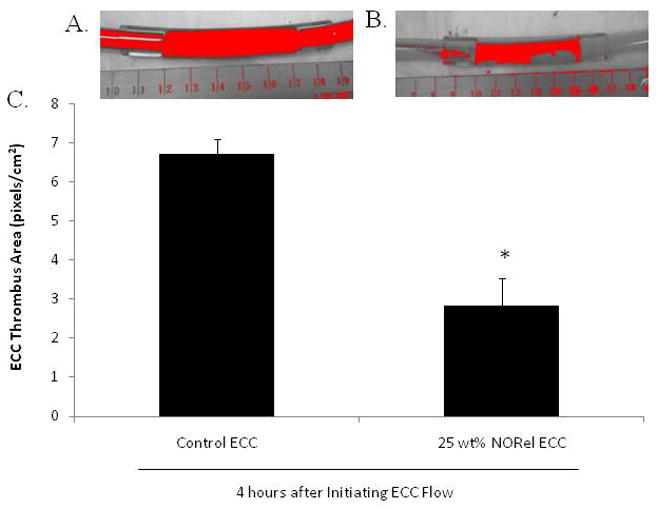
Two-dimensional representation of thrombus formation NORel and control polymer ECCs after 4 hours blood exposure in rabbit thrombogenicity model. (A) Colorized image of thrombus in 3/8 inch I.D. tubing (red region) in the control ECC. (B) Colorized image of thrombus in 3/8 inch I.D. tubing (red region) in the NORel polymer ECC. (C) Quantitation of thrombus area as calculated using ImageJ software from NIH. The data are means ± SEM. * = p<0.05, control ECC vs 25 NORel ECC after 4 hours.