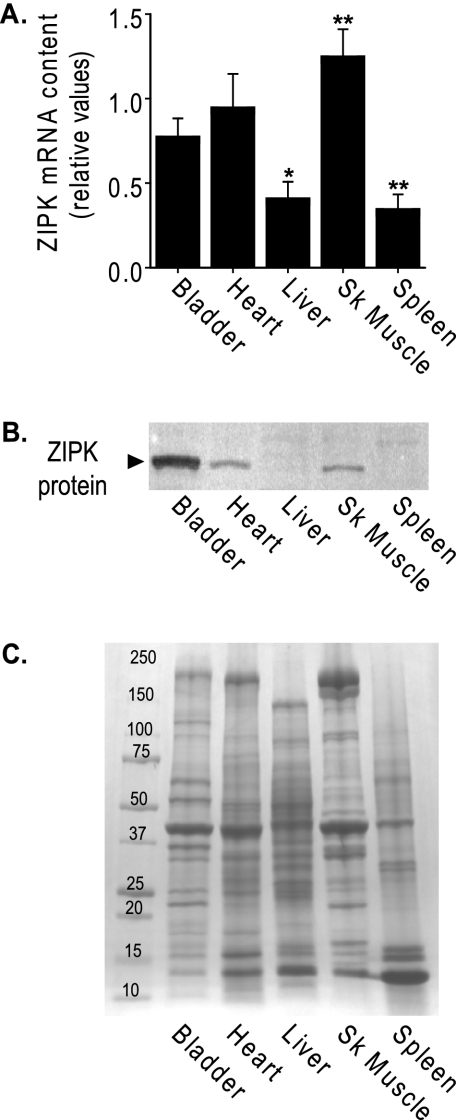
FIGURE 1.
Expression of ZIPK mRNA and protein in tissues. A, quantitative comparison of ZIPK mRNA in mouse tissues by QPCR. Relative quantities are shown as ratios of amounts found in each tissue relative to the amount in cerebellum, after normalization to an internal control, mouse cyclophilin B. Bars ± S.E. represent the average of separate experiments using tissues from different wild-type C57 mice. Measurements were performed in triplicate (* = p < 0.05 and ** = p < 0.001 versus bladder), n = 5 for all except skeletal muscle (SK Muscle, n = 4). B, ZIPK protein expression in mouse tissues. Total tissue proteins (∼10 μg/lane) were separated by SDS-PAGE and ZIPK protein (▶) shown by Western blotting. C, Coomassie Blue-stained gradient gel shows equal loading of total protein. Mass markers (kDa) are indicated.

