FIGURE 2.
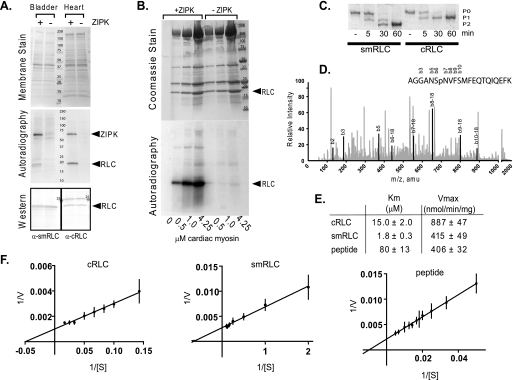
Identification of cardiac RLC as a substrate for ZIPK. A, ZIPK substrate search in mouse bladder and heart tissue homogenates incubated with (+) or without (−) purified ZIPK. Upper panel, assay samples were subjected to electrophoresis on a 4–20% gradient gel and transferred to PVDF membrane. Total proteins on membrane are shown by MemCode PVDF stain (Pierce), and mass of markers (kDa) is indicated. Middle panel, proteins phosphorylated by ZIPK were visualized by autoradiography of membrane shown in the upper panel. Lower panel, RLC band presence in lanes with (+) or without (−) added kinase was confirmed subsequently by Western blot analysis of the same membrane used in the upper and middle panels. Specific antibodies used to detect cardiac (α-cRLC) and smooth muscle RLC (α-smRLC) are indicated. B, RLC in cardiac myosin is a substrate for ZIPK. Purified ZIPK (300 ng) was incubated with 0.5–4.25 μm purified myosin (molecular mass 520 kDa) for 3 min in 50 μl of assay buffer. Top panel, Gelcode Blue Safe (Pierce)-stained 4–20% gradient gel of assay samples resolved by SDS-PAGE. Mass markers (kDa) are indicated. Dominant proteins include myosin heavy chain (200 kDa), actin (45 kDa), myosin light chain 1 (24 kDa), and RLC (20 kDa). Bottom panel, autoradiograph of gel with + and − symbols depicting the presence or absence of kinase, respectively. C, purified recombinant human smooth muscle RLC and human cardiac RLC (1 μg each) were phosphorylated with ZIPK for the indicated minutes and resolved by urea/glycerol-PAGE. Non- (P0), mono- (P1), and di- (P2) phosphorylated forms are indicated. D, phosphorylated cardiac RLC was subjected to phosphorylation site identification by LC/MS/MS where greater than 90% of protein was analyzed, and the peptide shown contained the only phosphorylated residue. Peaks that correspond to specific b residues are darkened and labeled. The b6 residue that corresponds to Ser-15 is the only site phosphorylated. amu, atomic mass units. E, the rates of phosphorylation of cardiac RLC (n = 4), smooth muscle RLC (n = 5), and RLC peptide (n = 3) by ZIPK were measured at different substrate concentrations, and average Km and Vmax values with S.E. were determined from independent nonlinear regression analysis using GraphPad Prism software. F, Lineweaver-Burk plots of the average values are shown.

