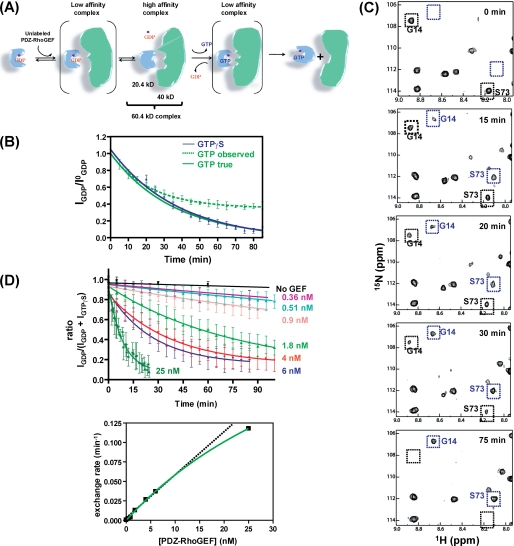
FIGURE 1.
RhoA nucleotide exchange in the presence of DH-PHPRG monitored by NMR. A, schematic of RhoA nucleotide exchange mediated by DH-PHPRG. 15N-labeled RhoA (blue, 20.4 kDa) with GDP and Mg2+ (purple) bound is in an inactive state. DH-PHPRG (green, 43 kDa) interacts with residues in the RhoA switch regions, promoting the release of GDP. Subsequently, GTP binds RhoA, and the GEF is released to produce the activated form of RhoA. B, kinetics of RhoA-GDP nucleotide exchange to GTP (green dashed line) and GTPγS (blue) measured by the real-time NMR assay. A theoretical GTP exchange curve corrected for hydrolysis (see supplemental material) is also presented (green solid line) Error bars indicate S.D. for values reported by multiple peaks. C, snapshots of 1H-15N HSQC spectra during the 75-min time course of RhoA-GDP to GTPγS nucleotide exchange, in the presence of DH-PHPRG (6 nm). Black and blue boxes indicate the positions of the RhoA-GDP and RhoA-GTPγS cross peaks, respectively, for Gly-14 and Ser-73. D, RhoA-GDP to GTPγS nucleotide exchange, with increasing concentration of DH-PHPRG. The intrinsic nucleotide exchange rate is shown in black. Nucleotide exchange rates k (10−4 min−1) are 5.5, 19, 24, 39, 130, 267, 371, and 1,179 for GEF concentrations of 0, 0.36, 0.51, 0.9, 1.8, 4, 6, 25 nm, respectively. Lower panel, the hyperbolic (green curve) dependence, on GEF concentration, of the nucleotide exchange rate is indicative of a two-step binding model.

