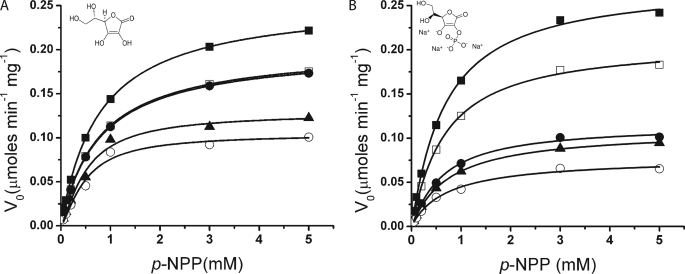
FIGURE 2.
AcpA enzyme kinetics in presence of inhibitors. Assays were performed in triplicate in 96-well plates using the model substrate pNPP in 25 mm MES buffer, pH 6.2, with 1 μg/ml purified enzyme. Enzyme activity was monitored continuously, and the initial velocity (V0) was calculated from the linear range. The kinetic parameters were estimated by nonlinear regression analysis using MicroCal Origin 8. Symbols: The control assay (no inhibitor added) is indicated by ■ in both panels. The symbols used to identify the concentrations of ascorbate are: A, 0.05 mm (□), 0.25 mm (●), 0.5 mm (▴), and 0.75 mm (○). 2-Phosphorascorbate results are depicted in B and the concentrations used were 0.05 μm (□), 0.25 μm (●), 0.5 μm (▴), and 0.75 μm (○). The values used in each figure are the average of three independent determinations. The chemical scaffolds of the inhibitors used in each case are shown as sodium salts.

