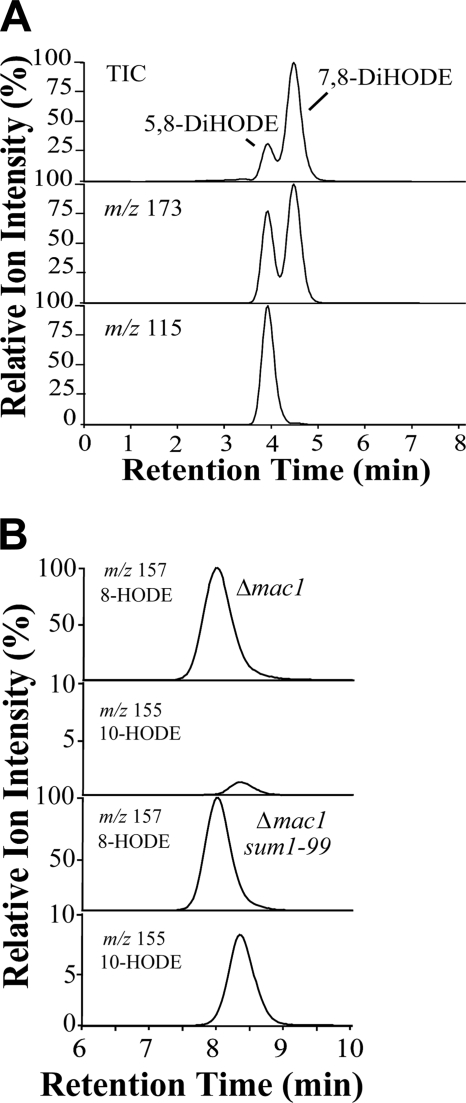
FIGURE 7.
LC-MS analysis of products formed from 18:2n-6 by two mutants of M. oryzae, Δmac1 with disruption of adenylate cyclase and Δmac1 sum1–99 with augmented PKA activity. A, RP-HPLC-MS/MS analysis of DiHODE formed by Δmac1 sum1–99. The top chromatogram shows total ion current (TIC) during MS/MS analysis (m/z 311→ full scan), the middle m/z 311→ m/z 173 (a characteristic ion in the MS/MS spectra of both 7,8-DiHODE and 5,8-DiHODE), and the bottom chromatogram m/z 311→ m/z 115 (−OOC-(CH2)3-COH; a characteristic ion in the MS/MS spectrum of 5,8-DiHODE). Only traces of 5,8-DiHODE were formed by Δmac1 mutant (data not shown). B, RP-HPLC-MS/MS analysis of 8- and 10-HODE. The reconstructed ion chromatograms for detection of for 8-HODE (m/z 295→157) and 10-HODE (m/z 295→155 (183–18)) in the Δmac1 strain. The bottom chromatograms showed an 8-fold relative increase in formation of 10-HODE by the Δmac1sum1–99 strain. The ion chromatograms of 10-HODE were magnified 10 times, as indicated.

