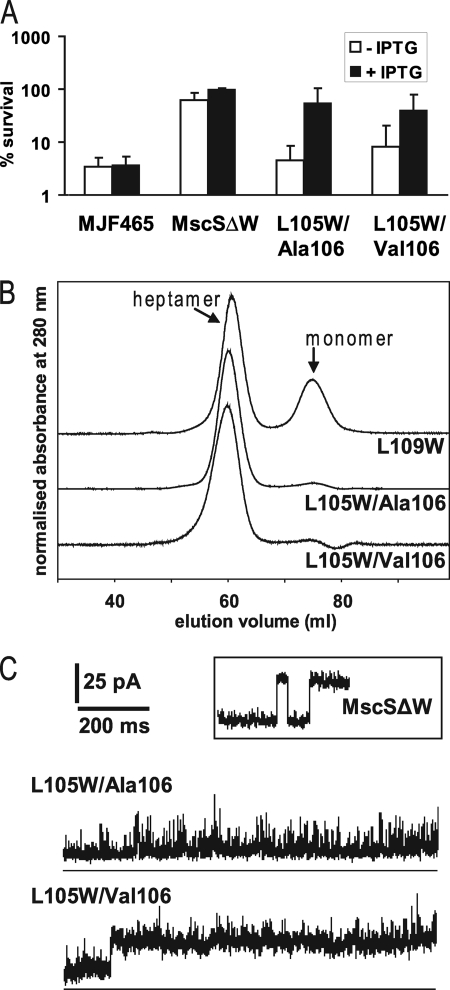
FIGURE 2.
Functionality and stability of MscS mutants. A, osmotic down shock assay. Shown are the survival percentages relative to control samples. Samples that were induced with isopropyl 1-thio-β-d-galactopyranoside (IPTG) are shown as black bars, and samples without induction are shown as white bars. B, size exclusion profiles of the mutants MscS ΔW L109W, L105W/Ala106, and L105W/Val106. To determine the typical positions of heptameric and monomeric MscS in the elution profile (marked) fractions were taken for blue native electrophoresis and were observed to have masses typical of the heptamer and monomer, respectively (16). Intensities have been normalized and offset for clarity. C, examples of electrophysiological traces are shown. For comparison, a trace of the tryptophan-free mutant MscS ΔW is given in the inset.

