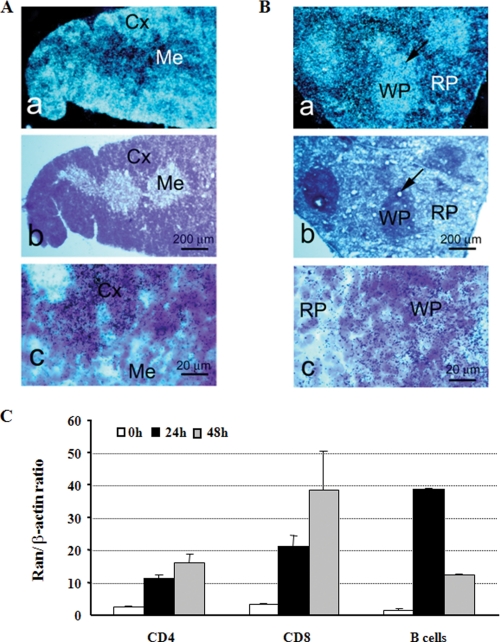
FIGURE 2.
Ran expression in lymphoid organs and cells. A and B, in situ hybridization of the thymus and spleen with antisense Ran probes. Panel a, dark field x-ray autoradiography; panel b, consecutive sections stained by hematoxylin; panel c, bright field emulsion autoradiography with hematoxylin counter staining. Cx, cortex; Me, medulla; WP, white pulp (indicated by arrows); RP, red pulp. C, real-time RT-PCR of Ran expression in lymphocytes. CD4 and CD8 cells were stimulated by solid phase anti-CD3 (0.57 μg/ml; concentration for coating the wells) plus anti-CD28 (2.86 μg/ml; concentration for coating the wells). B cells were stimulated by soluble anti-CD40 (0.1 μg/ml) plus IL-4 (10 ng/ml). The cells were harvested at 24 and 48 h, and total RNA was extracted for real-time RT-PCR, which was carried out in triplicate. Means ± S.D. of Ran versus β-actin signal ratios are shown. Data are representative of three similar experiments.

