FIGURE 4.
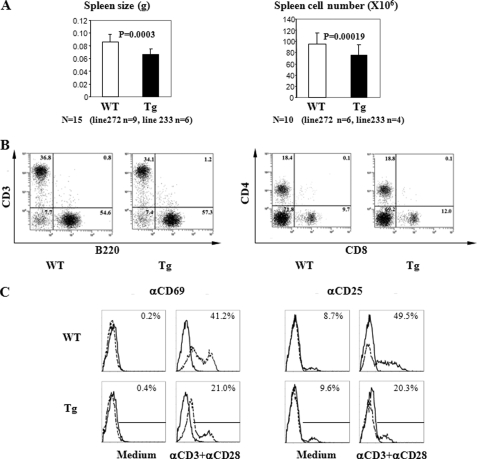
Spleen size and cellularity as well as spleen cell subpopulation and expression of their activation marker in Ran Tg mice. A, reduced spleen weight and cellularity in Ran Tg mice. Fifteen pairs of Tg mice and their WT littermates (nine pairs from line 272 and six pairs from line 233) were compared for their spleen weight, and 10 pairs (six pairs from line 272 and four pairs from line 233) were compared for their spleen cellularity. The difference was highly significant (p < 0.001, paired Student's t test) for both parameters. Error bars indicate ± S.D. B, spleen cell subpopulations of Ran Tg mice. The T cell (CD3+) and B cell (B220+) populations and CD4+ and CD8+ T cell populations in the spleens of Ran Tg mice (line 272) and their WT littermates were analyzed by two-color flow cytometry. The percentages are indicated in the histogram. C, C69 and CD25 expression on activated Ran Tg T cells. Ran Tg or WT T cells were stimulated overnight by solid phase anti-CD3 (4 μg/ml, concentration used during coating). The CD69+ or CD25+ expression on gated T cells (Thy1.2+) was measured by two-color flow cytometry (CD69/Thy1.2 and CD25/Thy1.2). The experiments described in panels B and C were repeated more than three times, and representative data are shown.

