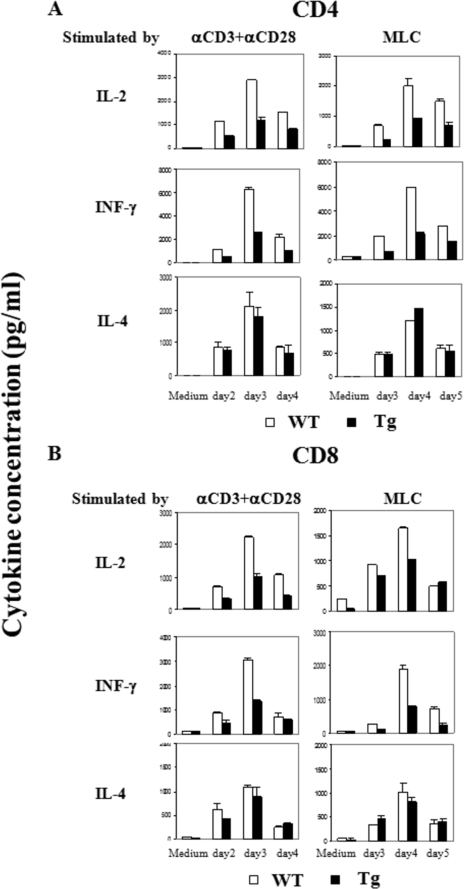
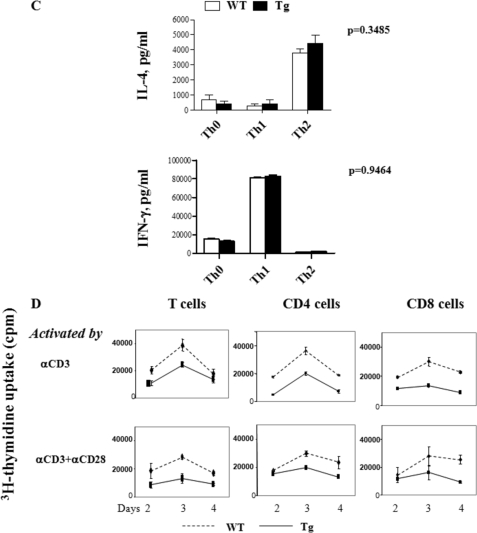
FIGURE 5.
Lymphokine production and proliferation of Ran Tg T cell. A and B, lymphokine secretion by CD4 and CD8 cells. Spleen CD4 (panel A) or CD8 (panel B) T cells from Ran Tg mice or WT littermates were stimulated by the following reagents or cells: solid phase anti-CD3 (0.57 μg/ml) plus anti-CD28 (2.86 μg/ml) (concentrations used during plate coating); mitomycin C-treated allogeneic BALB/c spleen cells in mixed lymphocyte culture (MLC); no stimulation (Medium). Supernatants were harvested on the days as indicated and assayed in duplicate for lymphokines by enzyme-linked immunosorbent assay. C, cytokine secretion by Th1 and Th2 cells. Naive CD4 cells (Th0) were driven into Th1 and Th2 cells under their respective culture conditions. The cells were stimulated overnight with 5 nm PMA and 500 ng/ml ionomycin, and the supernatants were then collected for cytokine analysis. D, proliferation of Ran Tg and WT total T cells, CD4 cells, or CD8 cells. The cells were stimulated by solid phase anti-CD3 (4 μg/ml) (concentration used during plate coating) or solid phase anti-CD3 (0.57 μg/ml) plus anti-CD28 (2.86 μg/ml). The cells were pulsed for 16 h with [3H]thymidine before harvest, and their [3H]thymidine uptake was measured on days 2, 3, and 4. The experiments were repeated more than three times, and representative data with means ± S.D. are shown.


