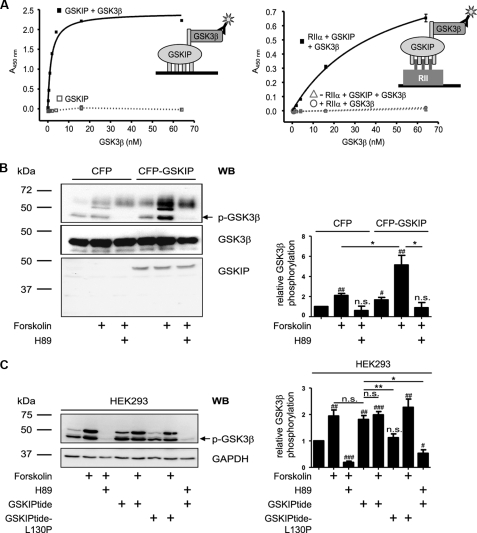
FIGURE 6.
GSKIP forms a ternary complex with regulatory RIIα subunits of PKA and GSK3β and facilitates PKA phosphorylation of GSK3β. A, left panel, wells of microtiter plates were coated with His-GSKIP (500 nm) and incubated with GSK3β (0.25–64 nm) in blocking buffer or with blocking buffer without GSK3β. GSK3β was detected with anti-GSK3β and secondary HRP-conjugated antibodies and an HRP-catalyzed reaction with a chromogenic substrate solution. Right panel, wells of microtiter plates were coated with RIIα (50 nm) in blocking buffer or with blocking buffer in the absence of RIIα. GSKIP (250 nm) in combination with increasing amounts of GSK3β (0.25–64 nm) was added. To quantify unspecific signals, the GSKIP-GSK3β-combination was incubated in wells blocked in the absence of RIIα (▵). Direct binding of GSK3β to RIIα was assessed by incubation of RIIα-coated wells with GSK3β (0.25–64 nm; ○). Detection was carried out as above. B, left panel, CFP or CFP-GSKIP was transiently expressed in HEK293 cells. The cells were left untreated, incubated with the direct activator of adenylyl cyclases, forskolin (20 μm, 30 min), or pretreated with the PKA inhibitor H89 (30 μm, 30 min prior to FSK treatment). Cells were lysed, and CFP-GSKIP, phosphorylated (p-GSK3β), and total GSK3β were detected with specific antibodies by Western blotting (WB). Right panel, signals obtained for p-GSK3β and GSK3β by Western blotting were analyzed densitometrically. The ratio of p-GSK3β to GSK3β was calculated (n = >5 independent experiments for each experimental condition, mean ± S.E.). C, left panel, HEK293 cells were treated with FSK or a combination of FSK and H89 as in B or with stearate-coupled GSKIPtide, which displaces GSK3β from GSKIP (20), or the inactive control peptide GSKIPtide-L130P (100 μm, 30 min). Cells were lysed and phosphorylated GSK3β (p-GSK3β) and GAPDH (loading control) were detected by Western blotting. Right panel, signals obtained for p-GSK3β and GAPDH by Western blotting were analyzed densitometrically. The ratio of p-GSK3β to GAPDH was calculated (n = 7 independent experiments for each experimental condition, mean ± S.E.). B and C, significantly different from untreated control: #, p < 0.05; ##, p < 0.01; ###, p < 0.001. Significant differences between groups connected by lines: *, p < 0.05; **, p < 0.01). n.s., not significant.

