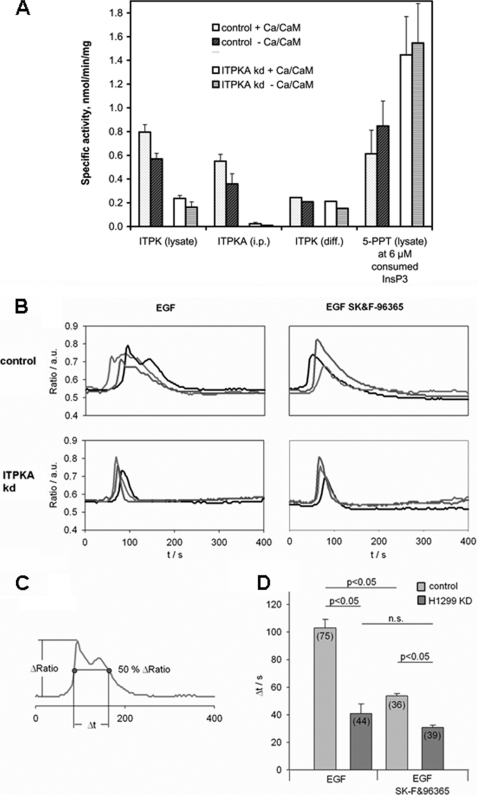
FIGURE 5.
Effect of ITPKA on EGF-stimulated calcium entry in H1299 cells. A, total cellular ITPK activity, cellular ITPKA-specific activity, calculated remaining cellular ITPK activity, and cellular Ins(1,4,5)P3-5-PPT activity, the latter assayed under “active ITPK” conditions (i.e. under Ins(1,3,4,5)P4 inhibition) was measured with and without Ca2+/CaM activation from dialyzed cellular protein extracts from control and ITPKA kd cells. Total protein extracts from H1299 control and H1299 kd cells or ITPKA specifically immunoprecipitated from total protein extracts were incubated with 10.75 μm Ins(1,4,5)P3 for 0, 5, 10, 20, and 40 min, and phosphorylation and dephosphorylation of Ins(1,4,5)P3 was analyzed by metal dye detection-HPLC. Specific activity (all referred to 1 mg of total cellular protein extract) was determined as described under “Experimental Procedures.” a.u., arbitrary units. B, Ca2+-imaging experiments on Fura 2-loaded H1299 control and H1299 kd cells in the presence or absence of the SOCE inhibitor SK&F-96365 (30 μm). Overlay of ratio tracings from individual representative cells stimulated with 100 nm EGF (at 20 s). C, duration of the signals was determined as the time the signal stays above 50% of the maximal amplitude. D, quantitative analysis of signal duration (data represented as mean ± S.E., two-way analysis of variance with Holm-Sidak post test was used to determine the difference between cell types and inhibitor treatment. Differences were considered significant at p < 0.05). n.s., not significant.

