
FIGURE 4.
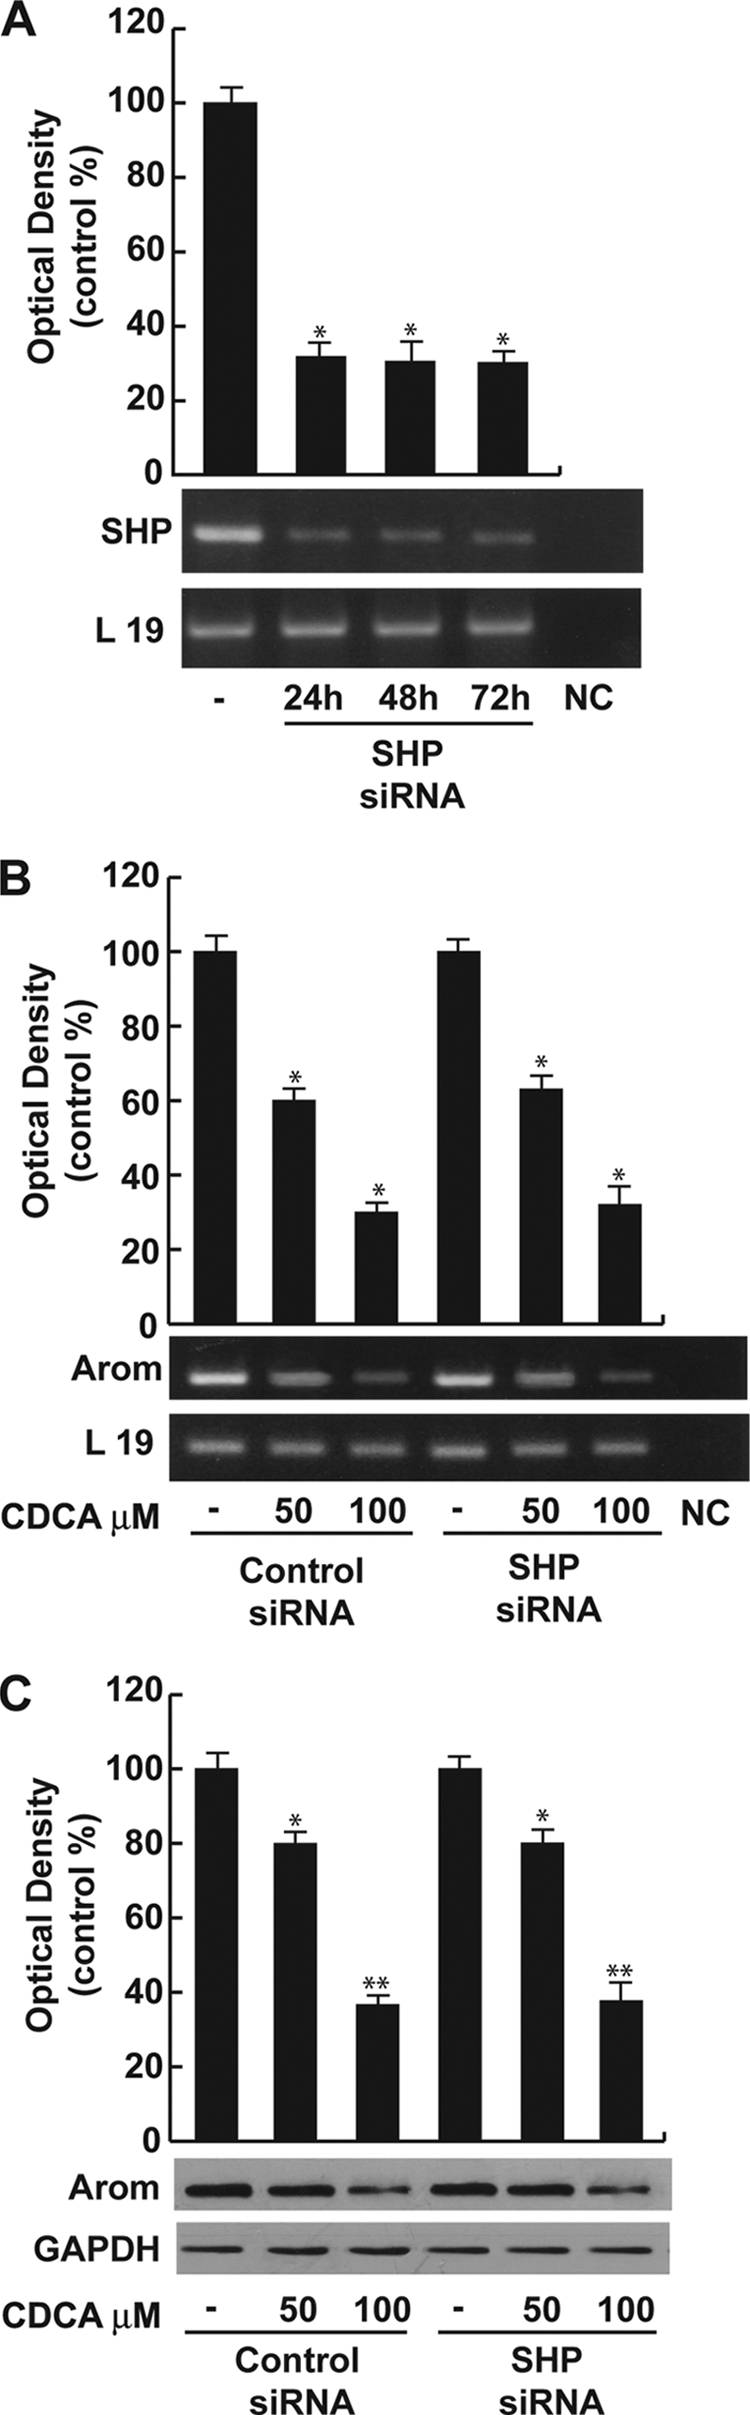
SHP is not involved in CDCA-mediated down-regulation of aromatase. A, SHP mRNA expression in R2C cells that were not transfected (−) or transfected with the siRNA-targeted rat SHP mRNA sequence as described under “Experimental Procedures” for 24, 48, and 72 h. L19 was used as loading control. NC, negative control, RNA sample without the addition of reverse transcriptase. The histograms represent the mean ± S.D. (error bars) of three separate experiments in which band intensities were evaluated in terms of optical density arbitrary units and expressed as percentages of the control, which was assumed to be 100%. *, p < 0.01 compared with not transfected cells. B, R2C cells were transfected with control siRNA or SHP siRNA for 24 h, and then treated with vehicle (−) or 50 and 100 μm CDCA for 24 h. Total RNA was extracted and reverse transcription-PCR analysis was performed to evaluate the expression of aromatase. L19 was used as loading control. The histograms represent the mean ± S.D. of three separate experiments in which band intensities were evaluated in terms of optical density arbitrary units and expressed as percentages of the control, which was assumed to be 100%. *, p < 0.01 compared with vehicle. C, in the same experimental condition as B, total proteins were extracted and Western blotting analysis was performed. GAPDH was used as loading control. The histograms represent the mean ± S.D. of three separate experiments in which band intensities were evaluated in terms of optical density arbitrary units and expressed as percentages of the control, which was assumed to be 100%. *, p < 0.05; **, p < 0.01 compared with vehicle.