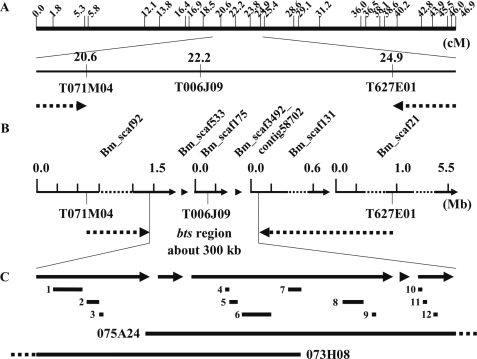
FIGURE 2.
Mapping of the bts mutation in linkage group 17. A, SNP markers and genetic analysis. Upper panel indicates the positions of SNP markers from bacterial artificial chromosome end sequences (17). Distances are shown in centimorgans(cM). In the lower panel, the dotted arrows indicate the result of rough mapping to narrow the region linked to the bts mutation. B, genomic scaffolds on the narrowed region and fine structure mapping. The dotted arrows indicate the result of detailed linkage analysis to narrow the region linked to the bts mutation. C, gene annotation in the bts-linked region. Arrows correspond to the scaffolds shown in B. Upper bars indicate 12 predicted genes and lower bars indicate 2 bacterial artificial chromosome clones, 075A24 and 073H08. 1, BGIBMGA007253; 2, 007308; 3, 007309; 4, 007220; 5, 007219; 6, 007221; 7, 007218; 8, 007217; 9, 007222; 10, 007238; 11, 007237; and 12, 007239.

