FIGURE 3.
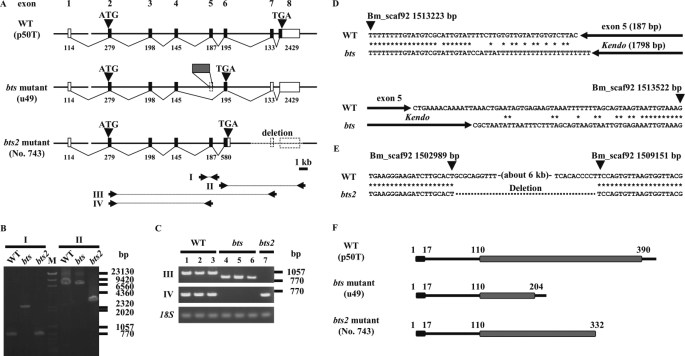
Schematic structures of the bts candidate gene from the wild-type (WT), bts, and bts2 strains. A, genomic structure of the bts candidate gene from the WT strain p50T (upper), the bts strain u49 (middle), and the bts2 strain No. 743 (lower). Bars and boxes indicate genomic DNA sequences and exons (black box, coding regions; white box, noncoding regions), respectively. Exon 1 is located on scaffold Bm_scaf175, whereas exons 2–8 are Bm_scaf92. Numbers show the lengths of exons. Arrowheads show the start and stop codons. The gray box of u49 indicates insertion of the retrotransposon, non-LTR Kendo. The dotted line in the structure for the bts2 strain indicates the observed genomic deletion. Primer sets used for genomic PCR and reverse transcription PCR are also shown (I–IV). B, genomic PCR. M, λ, and ϕ×174 DNAs were digested separately with HindIII and HincII, and mixed as molecular markers. I and II indicate the primer set of A. C, RT-PCR analysis in seven strains. Lane 1, p50T; lane 2, C108T; lane 3, u42; lane 4, u49; lane 5, w17; lane 6, w43; lane 7, No. 743. Lanes 1–3, WT strains; lanes 4–6, bts strains; lane 7, bts2 strain. III and IV indicate the primer set of A. D, genomic position and flanking sequences of the transposable insertion detected in the bts strain. Asterisks indicate identical nucleotides. E, genomic position of a deletion found in the bts2 strain. F, protein structure of WT, bts mutant, and bts2 mutant strains. Black and gray boxes indicate the signal-peptide and major royal jelly protein motif (MRJP), respectively.

