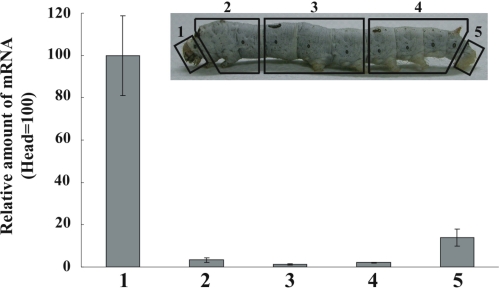
FIGURE 6.
Quantitative RT-PCR analysis of Bmyellow-e mRNA in the integument of five compartments. Upper figure shows the positions of the five compartments (1–5). Numbers correspond to those in the lower figure. Lower figure indicates the expression profiles of Bmyellow-e in the larval integument. Expression levels are shown relative to that detected in the head region (1). 18 S RNA was used as an internal control. Data are shown as means ± S.E. (n = 3).

