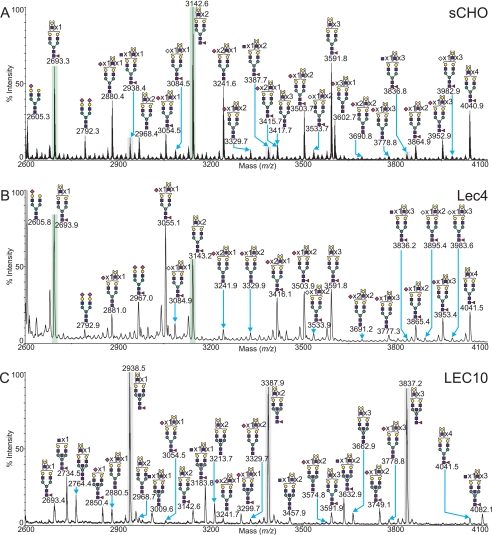
FIGURE 7.
Selected mass range comparison between the MALDI-TOF MS profiles of the permethylated N-linked glycans derived from CHO cells grown in suspension (A), the Lec4 mutant cell line (B), and the LEC10 mutant cell line (C). Peaks highlighted in gray or green are presented as such for comparative purposes (see text). For complete annotation of the spectra, see supplemental Table S1. Data were obtained from the 50% MeCN fraction and all molecular ions are present in sodiated form ([M + Na]+).

