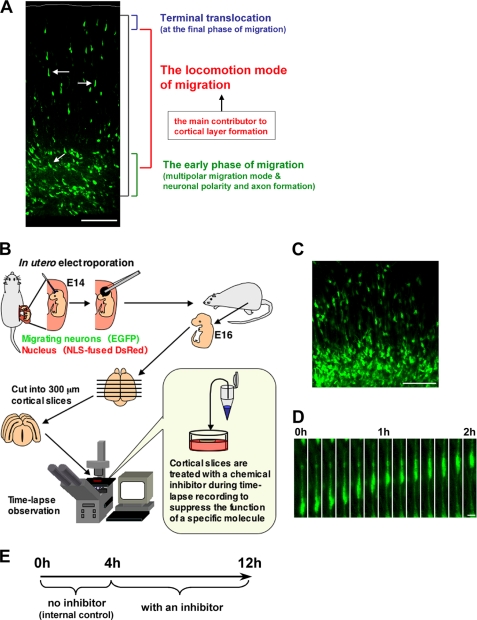
FIGURE 1.
An ex vivo chemical inhibitor screening for the molecules involved in locomotion. A, the cortical section of an electroporated brain, at E17, 3 days after electroporation. Black bracket shows the entire path of the neuronal journey at this stage. In the neuronal migration process, the locomotion mode (white arrow) covers most of the migration (red bracket). In contrast, at the early phase of the migration, neurons exhibit various morphological changes and neuronal maturation events, such as the formation of an axon and a leading process (green bracket). These various cellular events can hinder direct analysis of the mechanisms of the locomotion mode (red bracket) or the final phase (blue bracket) of neuronal migration. B and E, a schematic diagram for an ex vivo chemical inhibitor screening. Embryonic brains were electroporated with EGFP- and NLS-fused DsRed-expressing vectors at E14. After electroporation, the uterus was placed back into the abdominal cavity, allowing embryos to continue developing. 300-μm coronal slices were obtained with a microtome at E16, cultured on the insert membrane under time-lapse microscopy, and treated with chemical inhibitors as indicated. Because a few cells did not migrate even in the control slices, we compared the migration rate of inhibitor-treated locomoting neurons with that of the same one before the inhibitor treatment as an internal control (see “Results” and E). C, a cortical slice at the beginning of the slice tissue culture. At this stage (E16), the EGFP-electroporated cells were just transforming from multipolar neurons into locomoting neurons. D, time-lapse imaging of the locomoting neuron in a cultured tissue slice without any inhibitors. The cell can be observed to continuously migrate toward the pial surface with a locomoting morphology in the culture. Scale bars, 100 μm (A and C) and 10 μm (D).

