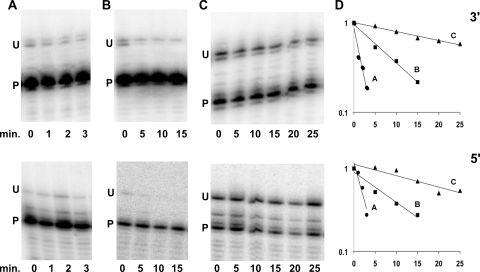
FIG. 2.
Kinetics of 23S rRNA maturation. Cultures were grown to mid-log phase, and aliquots were harvested for RNA preparation at various times, after the addition of rifampin to halt transcription, as indicated. (A to C) The extent of 23S rRNA maturation was assayed at the 3′ end (top) or the 5′ end (bottom) from the following strains: MG1655* grown in LB at 37°C (A), MG1655* ΔdeaD grown in LB at 37°C (B), and MG1655* grown in LB supplemented with 0.4 μg/ml of chloramphenicol at 37°C (C). The positions of the unprocessed (U) and processed (P) RNAs are indicated. The time, in minutes, at which cultures were harvested after rifampin addition is denoted below each panel. (D) The rates of 23S rRNA maturation shown in panels A to C were quantified by plotting the normalized ratio of unprocessed to processed rRNA remaining at different times after transcription inhibition. Individual data points for each graph are averaged over three independent experiments. The data were plotted on a semilogarithmic graph, and straight lines were obtained by linear regression. Maturation kinetics of the 3′ end (top); maturation kinetics of the 5′ end (bottom).

