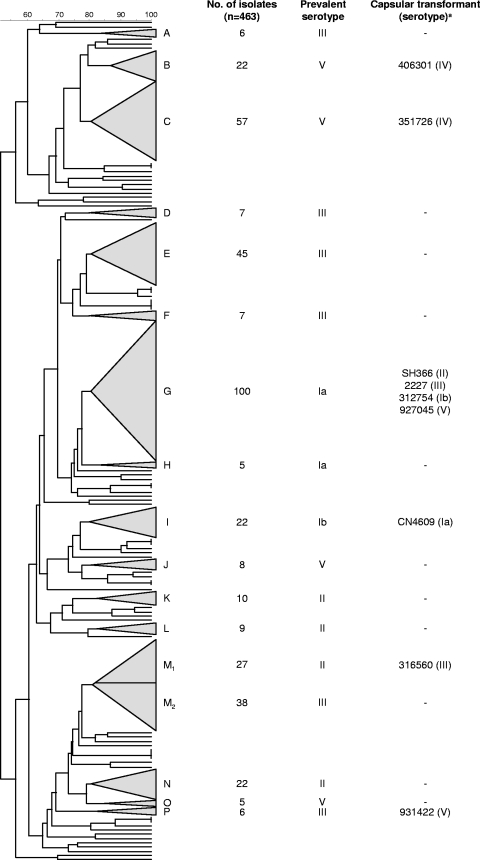
FIG. 1.
Dendrogram analysis of the PFGE profiles of 463 GBS isolates. UPGMA and the Dice coefficient (indicated as percentages in the scale above the dendrogram) were used to construct the dendrogram. Each PFGE cluster (defined as a group of ≥5 isolates with a Dice coefficient of ≥80% in the dendrogram) is represented by a triangle with size proportional to the number of isolates included in the cluster. The clusters are identified by capital letters outside each triangle. Putative capsular transformants were selected based on exhibiting a serotype different from the dominant serotype of the PFGE cluster. M1 and M2 are two sublineages of the same cluster, defined at >80% similarity in the dendrogram.

