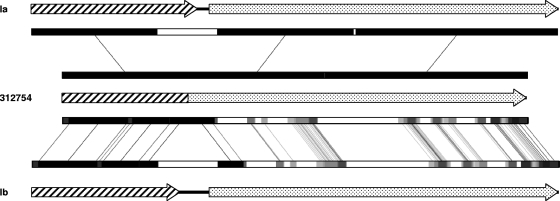
FIG. 3.
Diagram representing the DNA sequence of the cpsG-cpsH region of the capsular locus of S. agalactiae serotypes Ia and Ib compared to that of strain 312754. The cpsG and cpsH genes are represented by dashed and dotted arrows, respectively. The cpsG-cpsH fusion in strain 312754 is predicted to generate a fusion protein since the reading frame is maintained (see the text). The fragments with high DNA identity are represented by black boxes, whereas lower identity fragments are represented by lighter shades of gray. Similar fragments are connected by lines.

