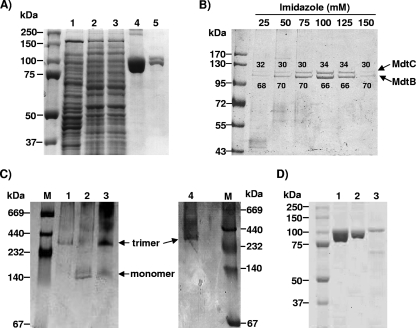
FIG. 2.
Copurification analysis showed that MdtB and MdtC form a heterotrimeric complex. (A) Copurification of MdtBHis and MdtC from E. coli AG100A ΔmdtABC-pSCBHis. The gels were stained with Coomassie blue. Lane 1, crude extract after French pressure cell lysis; lane 2, membrane protein extract after solubilization with DM; lane 3, Co2+ column flowthrough; lane 4, dissociated protomers from copurified MdtBHisC complexes eluted with 100 mM imidazole; lane 5, dissociated protomers from MdtB2C complex isolated by the stepwise gradient elution with imidazole, as specified in Materials and Methods. (B) SDS-PAGE analysis of the components of copurified MdtBHisC from stepwise imidazole gradient elution fractions. Proteins were expressed from plasmid pSCBHis. The gels were stained with Coomassie blue. The ratio of MdtB (lower band) to MdtC (upper band) within the copurified MdtBC complex, quantified by densitometry with Image J software, is shown as percentage values above or below each protein band. (C) BN-PAGE analysis of MdtBC complex reveals a trimeric aggregation state. The gels were stained with Coomassie blue. Affinity-purified MdtB (lane 1), MdtC (lane 2), and MdtBC (lane 3) were analyzed and compared with purified AcrB trimer (lane 4). High-molecular-weight standards for native electrophoresis (Amersham Biociences) are shown in lane M. (D) SDS-PAGE analysis of MdtB and MdtC monomers, produced by the dissociation of oligomers in SDS-containing sample buffer at room temperature. Lane 1, copurified MdtBC complex after dissociation into subunits; lane 2, His-tagged MdtB after affinity purification on Co2+ column; lane 3, His-tagged MdtC after affinity purification on Co2+ column. MdtC preparation shows several low-molecular-mass bands corresponding to degradation products of the protein.

