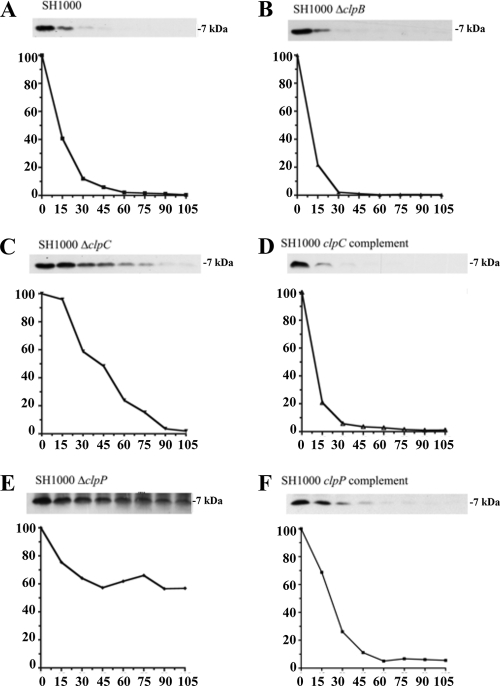
FIG. 4.
Comparative rates of MazEsa degradation in SH1000 wild-type and clp mutant strains. Wild-type (A), ΔclpB (B), ΔclpC (C), clpC complemented (D), ΔclpP (E), and clpP complemented (F) strains were transformed with pEPSA5::mazEC-myc (pALC6188). The cells were induced and transcriptionally stalled similarly to those in Fig. 3. At the top of each panel is a Western blot from the respective time points using a primary α-Myc antibody. The graphs depict the percentage of signal at each time point compared to t = 0. The experiments were repeated three times, and representative blots are shown.

