Figure 1.
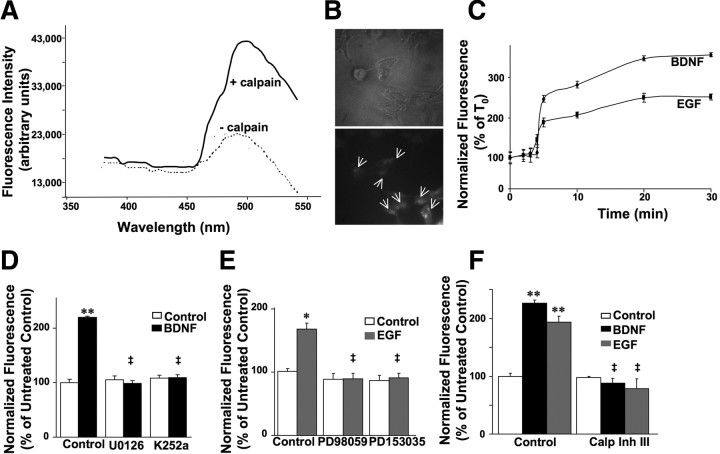
FRET analysis of calpain activation in vitro and in HEK–TrkB cells. A, Emission spectrum analysis of the FRET substrate incubated in the absence or presence of calpain. As expected, the peak of emission was at ∼480 nm. In the presence of activated calpain, a clear decrease in FRET was observed. B, FRET substrate (arrows) was internalized into HEK–TrkB cells (bottom). Top shows phase-contrast image of the same field. C, Kinetic of calpain activation by BDNF and EGF in HEK–TrkB cells. BDNF (50 ng/ml) or EGF (20 ng/ml) was added in cells preloaded with the FRET substrate, and fluorescence at 480 nm recorded at various times. Results are expressed as percentage of T0 and are means ± SEM of three experiments. D, BDNF-elicited calpain activation in HEK–TrkB cells is suppressed by MAPK inhibition or TrkB receptor inhibition. Fluorescence was measured 20 min after BDNF (50 ng/ml) addition in HEK–TrkB cells preloaded with the FRET substrate and pretreated with U0126 (10 μm) or K252a (0.5 μm). Results are expressed as normalized fluorescence (percentage of untreated control values) and are means ± SEM of six experiments with a total of 8–18 readings per condition. **p < 0.01 compared with control; ‡p < 0.01 compared with BDNF control samples. E, EGF-elicited calpain activation in HEK–TrkB cells is inhibited by MAP kinase inhibition or ErbB1 receptor inhibition. Fluorescence was measured 20 min after EGF (100 ng/ml) addition in HEK–TrkB cells preloaded with the FRET substrate and pretreated with PD98059 (25 μm) or PD153035 (0.5 μm). Results are expressed as normalized fluorescence (percentage of untreated control values) and are means ± SEM of six experiments with a total of 8–18 readings per condition. *p < 0.05 compared with control; ‡p < 0.01 compared with EGF control samples. F, BDNF- and EGF-induced calpain activation is blocked by calpain inhibitor III. Fluorescence was measured 20 min after BDNF (50 ng/ml) or EGF (100 ng/ml) addition in HEK–TrkB cells preloaded with the FRET substrate and pretreated with calpain inhibitor III (10 μm). Results are expressed as normalized fluorescence (percentage of untreated control values) and are means ± SEM of four experiments with three to four readings/experiment. **p < 0.01 compared with control; ‡p < 0.01 compared with BDNF and EGF control samples.

