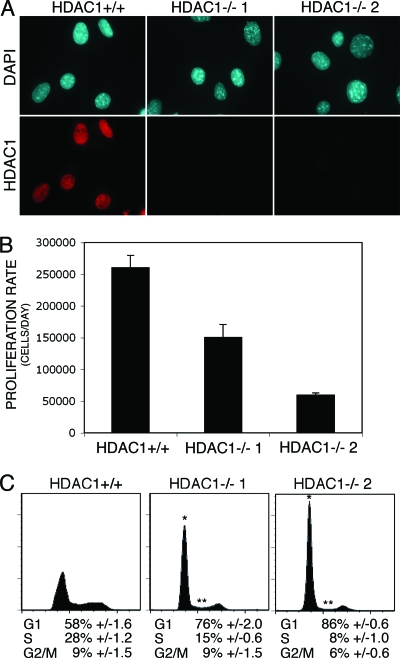
FIG. 6.
Characterization of immortalized HDAC1-deficient fibroblasts. (A) One immortalized HDAC1+/+ (WT) and two immortalized HDAC1−/− fibroblast lines were analyzed for the presence of HDAC1 by indirect immunofluorescence microscopy. Nuclei were visualized by using DAPI. (B) Proliferation rates of HDAC1+/+ and HDAC1−/− immortalized fibroblasts. A total of 105 cells were seeded and counted after time period of 3 days. The data are averages of triplicate determinations and are expressed as number of grown cells per day ± the SD. (C) FACS analysis of HDAC1+/+ and HDAC1−/− fibroblast lines. The experiment shown is representative for three independent experiments for each cell line. Asterisks indicate statistically significant differences in G1 (*) and S (**) phases between HDAC1+/+ and HDAC1−/− cells (for HDAC1−/− 1, PG1 = 0.00028 and PS = 0.00001 and for HDAC1−/− 2, PG1 = 0.0000004 and PS = 0.0000084 [Student t test]).

