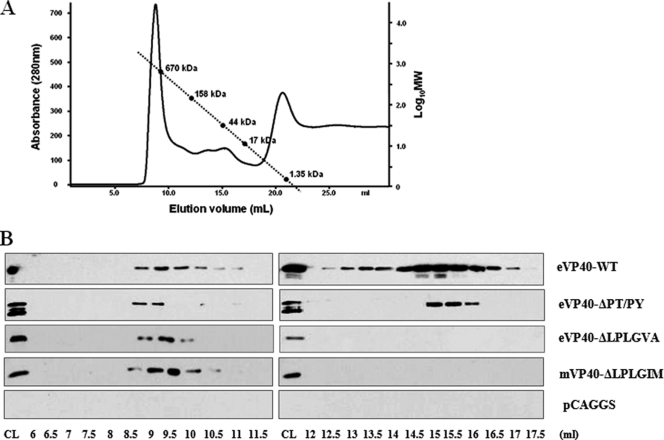
FIG. 6.
Gel filtration analysis of eVP40 and mVP40 proteins. Human 293T cells were transfected with the indicated plasmids. Cells were lysed with PBS containing 1% Triton X-100. Cell lysates were separated on a FPLC column. (A) The chromatogram for the eVP40-WT elution is shown as absorbance (280 nm) versus elution volume. Molecular mass standards (670, 158, 44, 17, and 1.35 kDa) were plotted along the dashed line as log values versus elution volume. (B) Western blot analyses of each protein are shown. pCAGGS empty vector served as a negative control.

