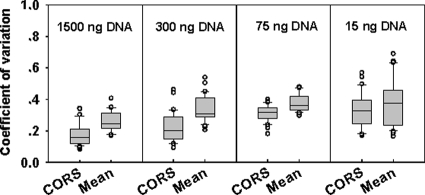
FIG. 2.
Box plots of variations of hybridization signal intensities among inter- and intrareplicates. A reduction of variations was observed when the CORS method was used for normalization compared to the mean signal intensity (mean) as evidenced by the paired Student t test with P < 0.001 for 1,500, 300, and 75 ng of gDNAs and P < 0.05 for 15 ng of gDNAs of equal mixtures of D. vulgaris, R. palustris, and S. oneidensis.

