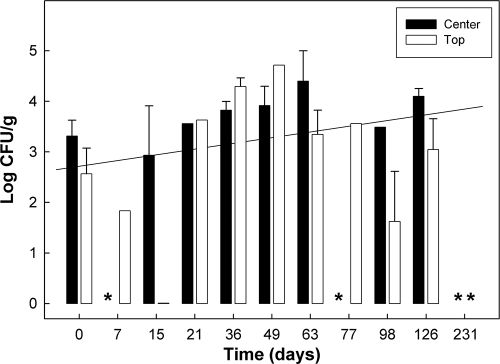
FIG. 6.
Temporal quantities of C. jejuni DNA in control treatment compost (center and top). Data obtained from EMA-treated and non-EMA-treated samples were combined. Vertical bars indicate standard errors of the mean, and asterisks indicate samples in which no C. jejuni DNA was detected. The diagonal line represents the linear relationship between time and C. jejuni DNA concentration (y = 2.72 + 0.113x).

