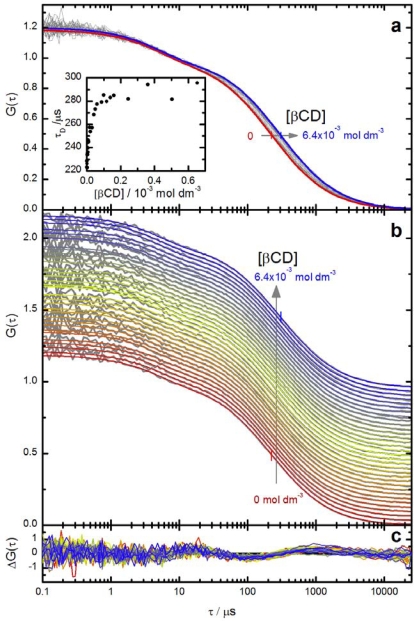
Figure 4.
Fluorescence intensity correlation curves G(τ) of Ada-A488 in the presence of increasing concentrations of βCD ([βCD] = 0 mol dm−3 to 6.4 × 10⁻³ mol dm−3) in aqueous solution. ([Ada-A488] ≈ 10−9 mol dm−3). Panel a: normalized experimental correlation curves at increasing βCD concentration (grey curves) and two representative curves from the global fit of Equations. (9) and (10) at [βCD] = 0 mol dm−3 (red curve) and [βCD] = 6.4 × 10⁻³ mol dm−3 (blue curve) to the correlation curves. The intermediate fit curves are not shown for clarity. Small vertical bars indicate the diffusion time obtained from the fit. Inset: mean diffusion times τ̄D as function of βCD concentration determined from individual fits of the Equation (9) to the correlation curves. The highest concentrations are not shown. See also Figure 5. Panel b: stacked representation of the same correlation curves as in panel a. Panel c: weighted residuals from the global fit (vertical scale is arbitrary).

