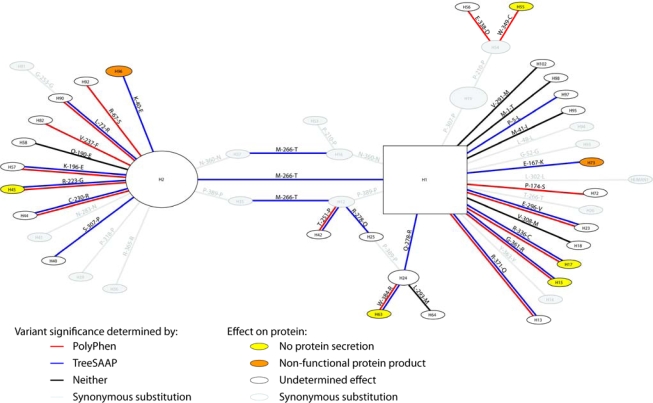
Figure 1.
Phylogenetic network showing relationships among sampled haplotypes. Edges are labeled with the base or amino acid change and colored based on results from significant.PolyPhen and TreeSAAP results. The nodes are colored according to the known effect of the variant on the protein as determined by in vitro assays [3,4]. Yellow nodes indicate variants that prevent secretion; orange nodes indicate variants that cause a nonfunctional protein to be secreted; white nodes were not tested in vitro; and gray is a synonymous substitution.

