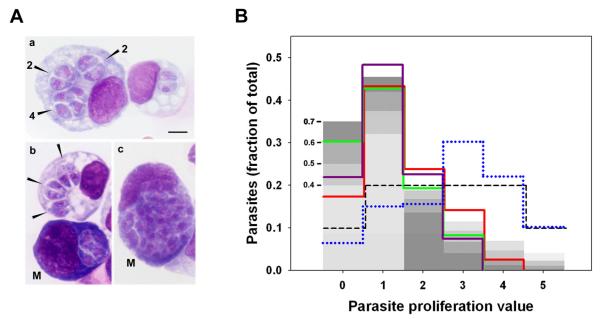
Figure 1. Distribution of intravacuolar parasite content in acute toxoplasmosis.
Mice were infected intraperitoneally with T. gondii RH strain. (A) After 4 or 5 days, cytospin preparations of peritoneal exudate were Wright stained and parasitophorous vacuoles (arrowheads in a, b) were evaluated for parasite content. a, representative macrophages containing vacuoles in which 1 to 2 divisions have taken place (the number of parasites in each vacuole is indicated). b, an infected macrophage adjacent to an infected presumptive mesothelial cell (M). c, a mesothelial cell (M) with a vacuole bearing 32 parasites. Scale bar: 5 μm. (B) Parasite enumeration data were used to calculate the distribution of parasite proliferation value (the number of divisions within the vacuole for each parasite) in infected mononuclear cells. Each of the solid colored lines represents the distribution in total mononuclear cells from one mouse. For each sample, 300 - 400 vacuoles (approximately 600-800 total parasites) were scored. One sample (green line) is from d5 post-infection; the others are from d4. The data are representative of four total mice obtained from three independent experiments. The blue dotted line displays the distribution in mesothelial cells (pool of two mice from independent experiments; 87 total vacuoles, 376 total parasites assessed). The grey bars indicate the theoretical distribution under probabilistic egress, with each shade representing a different probability, as indicated by the numbers on the left (see text). The dashed line indicates the theoretical distribution for proliferation-dependent egress (see text).

