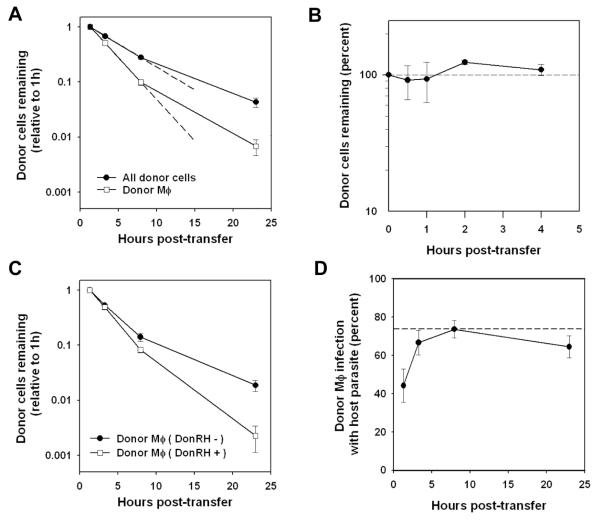
Figure 4. Kinetics of inflammatory cells in acute toxoplasmosis. (A, C, D).
Samples from the adoptive transfer described in Fig. 3 were stained with F4/80 to identify macrophages. Data are representative of 3 - 4 experiments (A) The recovery of donor macrophages and total donor cells (in each case as a ratio to total cells, relative to 1 h post-transfer) was determined by flow cytometry. Linear regressions (dashed lines) were calculated based on 1 h - 8 h data. (B) Donor and host mice were each injected intraperitoneally with thioglycolate. After 5d, donor exudate cells were harvested, labeled with CellTracker Orange, and injected into host mice. Groups of three mice were sacrificed at the indicated times to determine donor cell recovery. (C) Comparison of the recovery of donor macrophages infected or uninfected with donor parasites (reflecting infection status at the time of transfer). (D) The percent of donor macrophages infected with host parasite was monitored at the indicated times and compared to the frequency of host parasite infection of host macrophages (dashed line).

