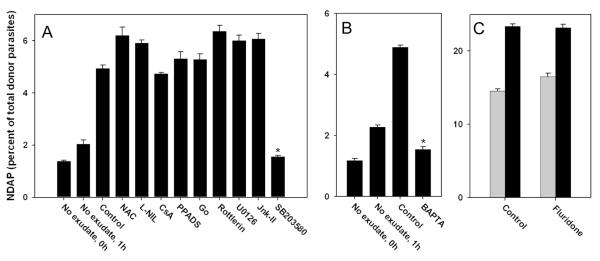
Figure 8. Effect of signaling inhibitors on ETE.
ETE assays were performed as described for Fig. 7E. Bars represent mean ± S.E. (n = 4). (A, B) PEM were cultured with exudate in the absence (Control) or presence of the indicated inhibitors. The inhibitors used were N-acetylcysteine (NAC, 10 mM), L-NIL (1 mM), cyclosporine A (CsA, 5 μM), PPADS (30 μM), Go 6976 (Go, 1 μM), rottlerin (5 μM), U0126 (10 μM), JNK Inhibitor II (Jnk-II, 10 μM), SB203580 (10 uM), and BAPTA-AM (BAPTA, 10 μM). (A) and (B) represent separate experiments. * p < 0.05. (C) The ETE assay was performed on donor PEM that were first cultured overnight in either control medium (Control) or 50 uM fluridone, and then incubated in the absence (gray bars) or presence (black bars) of exudate. The data in the figure are representative of either 8 experiments (SB203580) or 2-3 experiments (other inhibitors).

