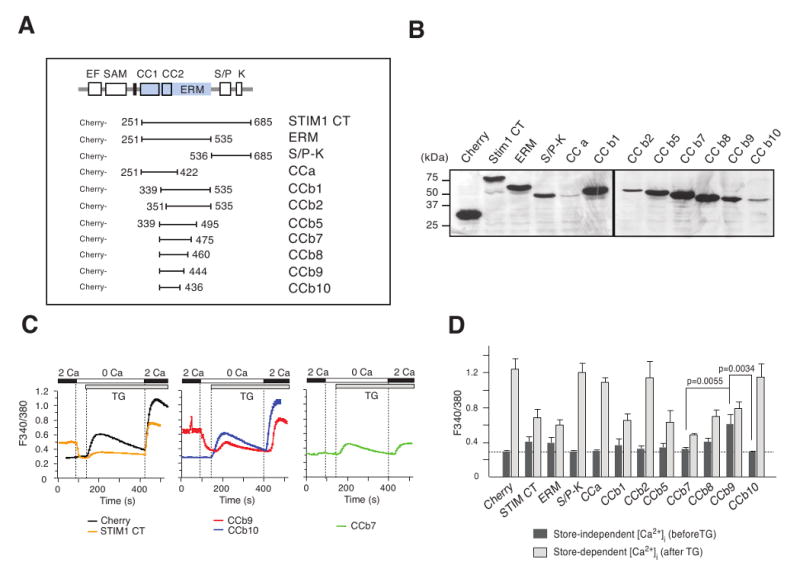
Figure 1. Identification of CRAC channel activating regions in STIM1.

(A) Schematic representation of STIM1 protein domains and C-terminal fragments generated in this study. CC, coiled-coil; CT, STIM1 C-terminus; EF, EF hand; ERM, ezrin/radixin/moesin; SAM, sterile alpha motif; TM, transmembrane; S/P, serine-proline; K, lysine. (B) Western blot of STIM1 C-terminal fragments. HEK293 cells were transfected with FLAG-Cherry-tagged STIM1 fragments, cell lysates separated by SDS-PAGE and STIM1 fragments detected with anti-FLAG antibody. (C) Store-independent and store-dependent Ca2+ influx in cells expressing STIM1 fragments. HEK293 cells were transfected with Cherry-tagged STIM1 fragments and [Ca2+]i was measured by single cell time-lapse imaging in 2 mM Ca2+o before and after addition of 1 μM thapsigargin (TG). Traces represent mean 340/380 Fura-2 emission ratios from one representative experiment; error bars represent s.e.m. (D) Summary of experiments similar to those shown in (C). Bar graphs represent average peak [Ca2+]i in 2 mM Ca2+o before (dark gray) and after thapsigargin (light gray) addition from 3-6 independent experiments; error bars represent standard deviation.
