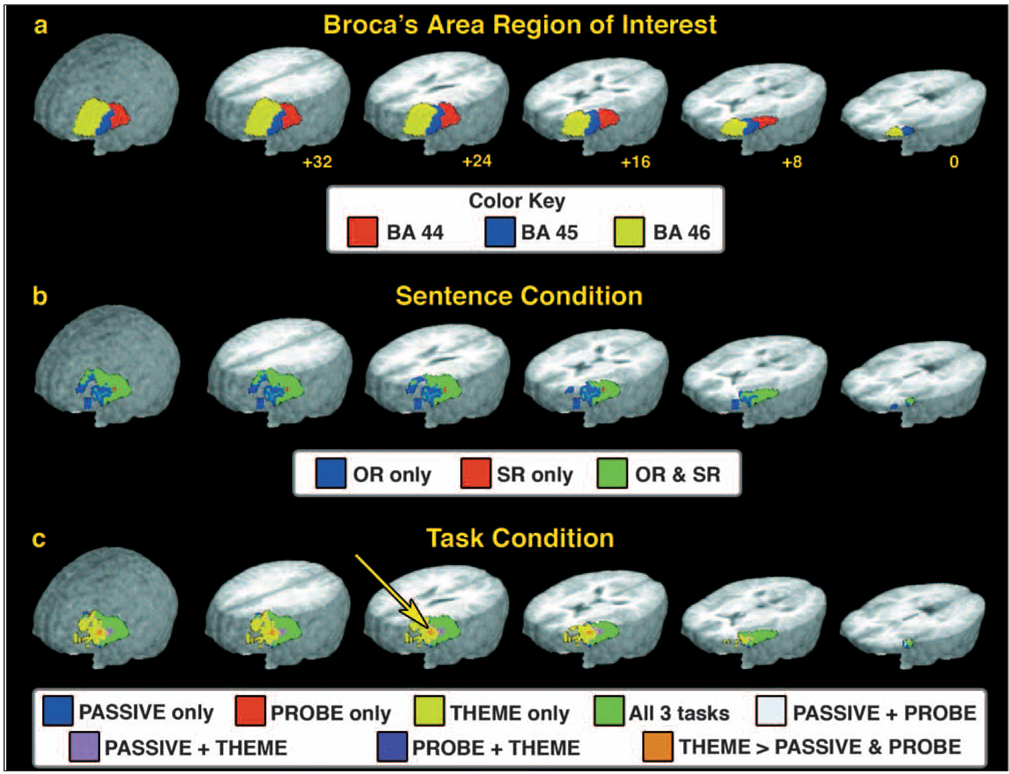
Fig. 2.
fMRI activation results from the ROI analysis. a) Region of interest used for the ROI analysis. The three BA in the left hemisphere lateral frontal cortex, BA 44, 45, and 46, used in the ROI are shown. Although shown here separated, the ROI analysis included all three regions as a single ROI. b) fMRI results from the analysis of the Sentence condition. Results indicate where activity exceeded the baseline condition for the OR and SR sentences either separately (‘OR only’ and ‘SR only’) or where both sentence constructions showed greater than baseline activation (‘OR and SR’). No voxels were found that significantly differed between the sentence constructions. c) fMRI results from the analysis of the Task condition. The color coding indicates regions where activity exceeded the baseline condition and which tasks were associated with that activity. The yellow arrow indicates a region in the inferior frontal gyrus (BA 46) where the activity during the THEME task was greater than that observed in both the PROBE and PASSIVE tasks. The ROI and fMRI results are displayed on a 3D rendering of the averaged brain obtained by forming a mean image from the structural MRI from each of the 10 participants. The slices displayed in the rendering are at +32 mm, +24 mm, +16 mm, +8 mm, and 0 mm superior to the line formed by anterior and posterior commissures (‘AC-PC’ line) in Talairach coordinates.

