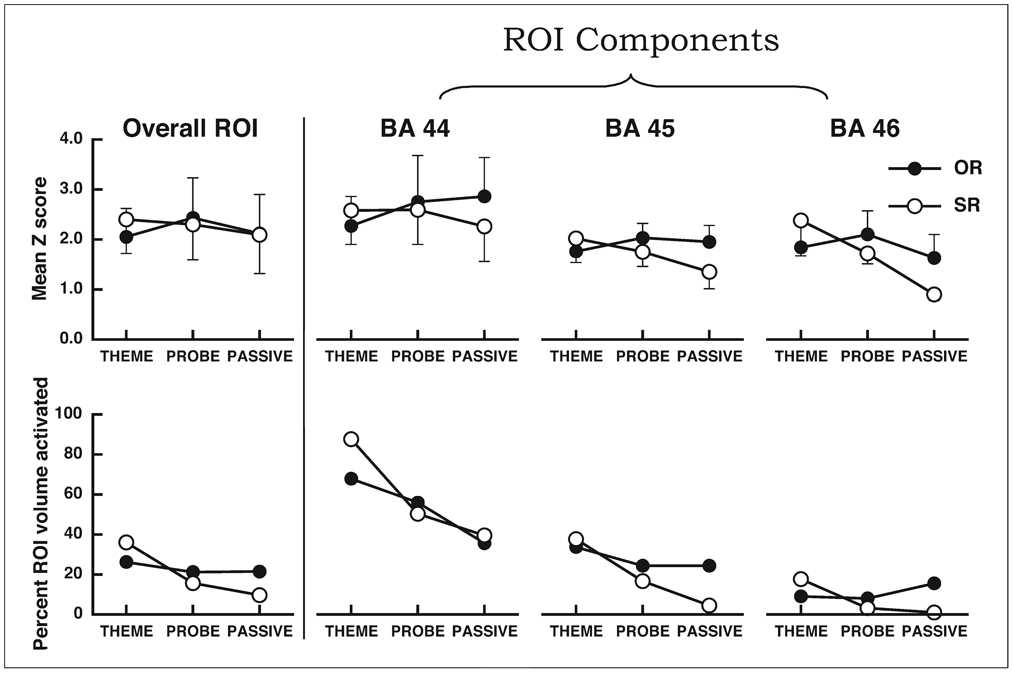
Fig. 3.
Mean intensity and volume measures from the ROI analysis. The top panels display the mean Z scores for each of the six separate sentence-task combinations for the overall ROI (leftmost graph) and the three subregions of the ROI (BA 44, 45, and 46, rightmost graphs, respectively) for voxels that were identified as significantly active in the ROI analysis following the cluster-threshold correction. OR = object relative sentence constructions, SR = subject relative sentence constructions. Error bars indicated the standard deviation. The bottom panels display the percentage of the ROI that contained significantly active voxels.

