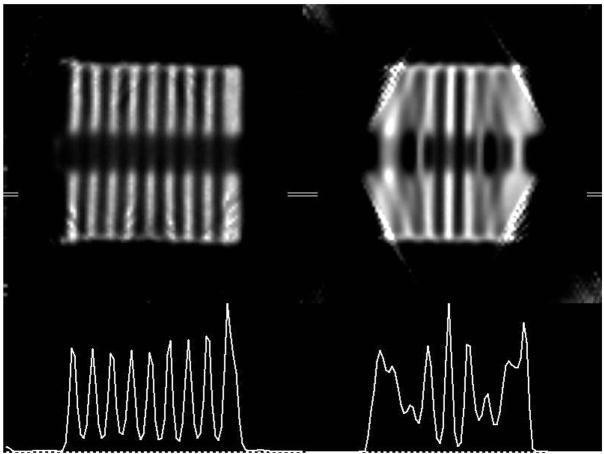
Figure 3.
Central sagittal slice of reconstructions (top) with their profiles (bottom) for helical (left) and circular (right) scans. The horizontal line segment indicates the region of the profile. Circular orbit (right) shows truncation artifacts (upper right) and quantitative innaccuracies (lower right) due to incomplete sampling.

