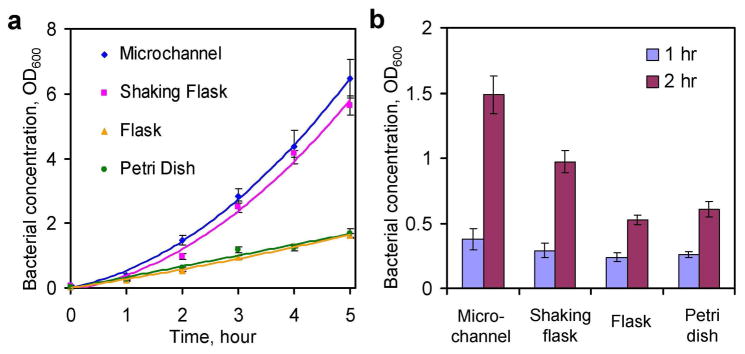
Figure 3.
Comparison of bacterial growth in a 200 μm microchannel (microchannel), an Erlenmeyer flask inside a shaking incubator (shaking flask), a static Erlenmeyer flask (flask), and a static Petri dish (Petri dish). (a) The bacterial growth curves for E. coli EC137 in different conditions. Bacteria in the shaking flask grew at a similar rate compared to bacteria inside the microchannel. The bacteria in the static flask and Petri dish displayed significantly lower growth rates compared to the microchannel. (b) Initial growth rates were similar after one hour for all experimental conditions. After two hours of bacterial culture, the growth rates can be clearly distinguished. Each data point represents at least four experiments. Data represent absorbance ±standard deviation.

