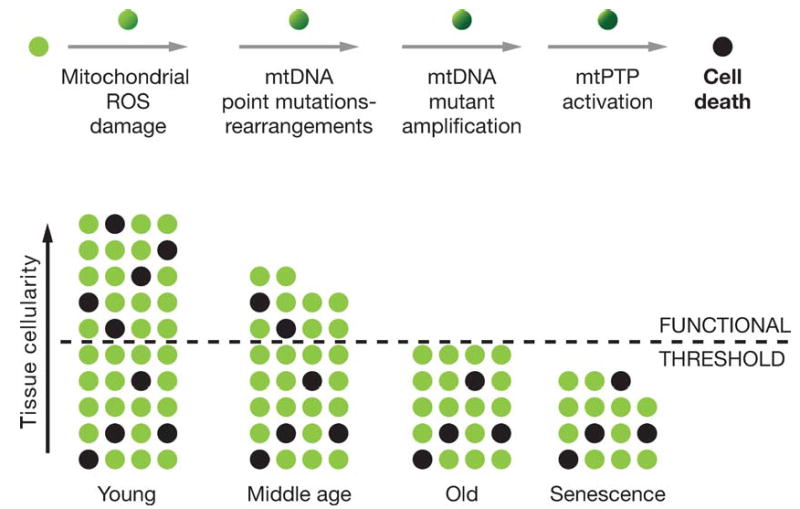
Figure 3.

Mitochondrial and cellular model of aging. The upper line of cells diagrams the mitochondrial role in the energetic life and death of a cell. The bottom diagram represents the loss of cells in a tissue over the life of an individual through mitochondrial-mediated death, black cells. The minimum number of cells for the tissue to function normally is indicated by the dashed line.
