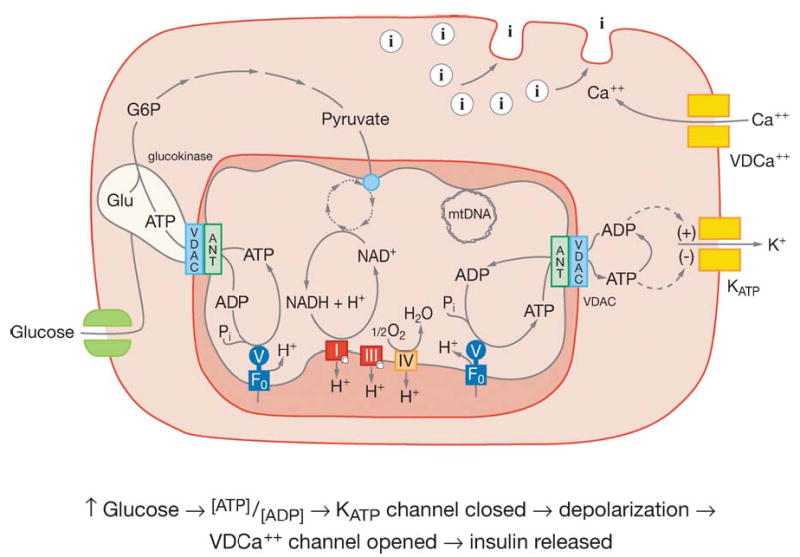
Figure 4.

Model of pancreatic β cell showing the mitochondrial regulation of insulin secretion. The light green blob associated with VDAC represents glucokinase. The green double squares in the plasma membrane on the left side represent the glucose transporter. The two pairs of double squares on the right side plasma membrane represent: below and labeled KATP the ATP gated K+ channel and above and labeled VDCa++ the voltage-dependent Ca++ channel. The circles with the internal “I” represent insulin containing vesicles. Other abbreviations as in Figure 2. Reprinted from Reference 25.
