
Figure 1. Increased glucose uptake in SIRT6 deficient cells and mice.
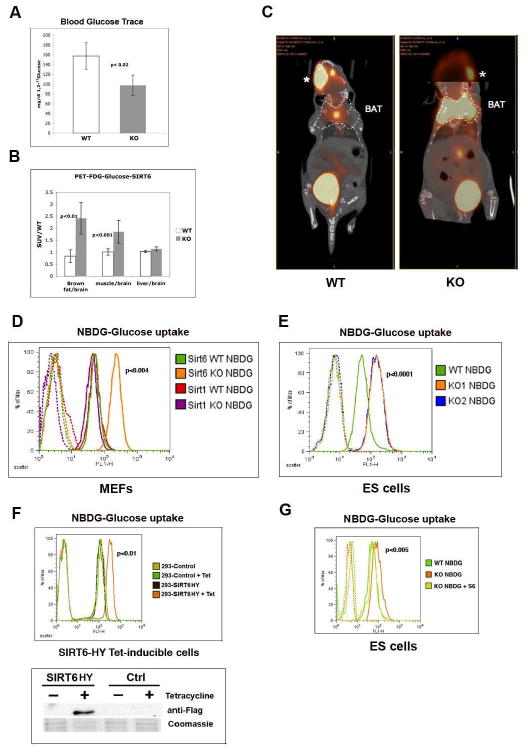
(A) [1,2 13C] labeled glucose trace assay was carried out on 16 days-old SIRT6 wild-type (WT) and knock-out (KO) mice. See Methods for details. (B) Standard Uptake Value (SUV) ratio of labeled 18FDG-Glucose incorporation in WT and KO SIRT6 mice. The different tissues analyzed are indicated. Samples were normalized against brain, which exhibit stable glucose uptake across genotypes. The experiment is an average of three mice per genotype. (C) 16-days old SIRT6 WT and KO mice were PET imaged 60 minutes following i.v. injection of 18F-glucose. Dotted lines indicate position of the brown adipose tissue (BAT). *: labeled glucose at site of injection (retro-orbital; the enhanced signal observed in the WT reflects the position of the head at this particular CT section; comparable intensity is observed in the KO on a different CT section). (D) SIRT6 WT and SIRT6 KO mouse embryonic fibroblasts (MEFs) together with SIRT1 WT and KO MEFs were grown in the presence of the fluorescent glucose analog NBDG (Invitrogen) for 1 hr., and glucose uptake was then quantified using flow cytometry (FACS). Dotted lines are controls without the fluorescent NBDG glucose analog. (E) One WT and two independently generated SIRT6 KO ES lines (KO1 and KO2) were treated as in (D), and analyzed by FACS. (F) 293T cells were stable transfected with a SIRT6 cDNA carrying a H133Y mutation (SIRT6HY) that acts as a dominant negative, under the control of the Tetracycline promoter. Lower panel: western blot showing that SIRT6 was induced specifically after tetracycline treatment (SIRT6). Empty vector was used as a control (Ctrl). Upper panel: glucose uptake was measured as in (D). (G) SIRT6 KO cells were infected with a SIRT6 expressing-lentivirus. Infected cells were sorted for GFP expression, and following expansion, cells were assayed for glucose uptake following 1 hr. incubation with NBDG. See also Figure S1.