
Figure 6. Increased Hif1α stability and protein synthesis in SIRT6 deficient cells.
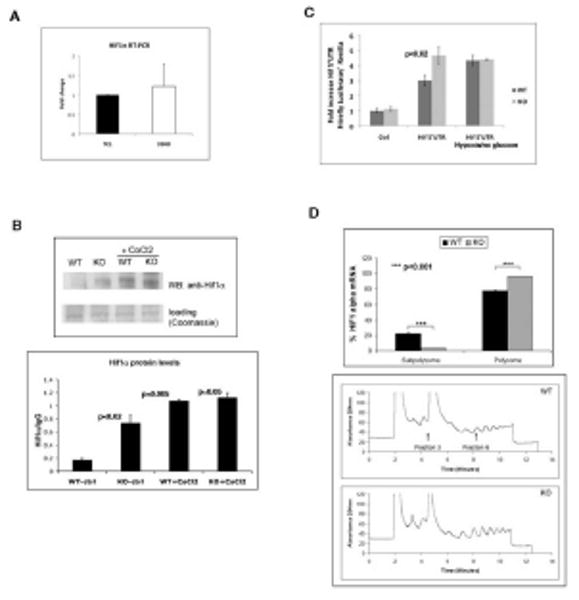
(A) RNA was purified from SIRT6 WT and KO ES cells and Hif1α expression was analyzed by RT-PCR using primers specific for the mRNA of Hif1α. Results are shown as the mean±SEM (n=6). (B) Upper panel: Lysates were prepared from SIRT6 WT or KO ES cells, followed by IP and western blot with a Hif1α antibody. Samples were either left untreated, or treated with the Hif1α stabilizer CoCl2 (150μM) for 24 hr. prior to lysate preparation. Lower panel: quantitative densitometric analysis of Hif1α levels from the upper panel blot. (C) Wild type (WT) and SIRT6 deficient (KO) cells were co-transfected with an empty 5′UTR-Luc vector or Hif1α- 5′UTR-Luciferase reporters and shifted 6hrs post-transfection to no glucose-hypoxia conditions for 24hrs for measurement of luciferase activity. (D) Polysome profile analysis of WT and Sirt6 deficient (KO) ES cells. lower panel : WT and KO cells were treated with cycloheximide (CHX) for 10 minutes before collection. The lysates were processed for polysome analysis by velocity sedimentation on sucrose gradients. Gradients were fractionated by scanning at 254 nm, and the resulting absorbance profiles are shown with sedimentation from left to right. Upper panel: Quantitative RT-PCR was performed to assess distribution of HIF1α mRNA. See also Figure S6.